|
|
Regional Climate and Water Availability The Key Word Is Variability The key to understanding the climate of the region is realizing that rainfall is highly variable. As seen in the chart below, average annual rainfall in San Antonio is 30.16", but averages mean little here. Forty inches of rain may fall in one year, but the next year there may be less than 20". Rainfall also decreases dramatically from east to west. The eastern portion of the Edwards Aquifer recharge zone around San Marcos often receives 50% more precipitation than the western portion near Brackettville. Rainfall is generally highest in the months of May and September, but it is not at all uncommon for periods of 60 to 90 days to pass without significant rain.
Intensity is Also Key When it does rain, the Edwards Plateau can experience some of the highest rainfall intensities in the world. In 1935, D'Hanis received 22 inches of rain in less than three hours. In 1972, New Braunfels recorded almost 14 inches of rain in less than four hours. In many years, most of the rain comes in a handful of intense events. For example, most of the rain in 1998 came during a few days in October when both a tropical cyclone and a cool front combined to produce several days of incredible rains. Up until then, 1998 had been one of the driest ever. Although water enters the Aquifer easily in the recharge zone, the subsurface drainage is generally inadequate to hold all the water that falls in large rain events. Recharge conduits and sinkholes quickly become filled and the remaining water has to flow over the surface. Flash floods are the result, and the region has some of the most extreme flash floods anywhere in the world. When the recharge conduits are filled, lots of water passes over the recharge zone but cannot enter the Aquifer, so intense storms often result in less recharge than if the rain had fallen over a longer period of time. Droughts can be just as severe as rainfall intensities. In 1995-1996 the San Antonio area did not see a significant rain event for almost a year, and some areas to the west did not have ANY rain in 4-5 years. In the fall of '96 I interviewed some West Texas ranchers who reported that no rain had fallen on their property in over eight years! The longest drought on record occurred in the 1950s, when the entire state was gripped by five successive years with below average rainfall. The droughts of '96 and '08-09 are regarded as being more severe than the drought of record in the 1950's, although their duration was shorter. In August of 2011, the previous 12 months were declared the worst one-year drought on record. Also in 2011, climatologists announced that Texas and Oklahoma had tied for the record of hottest summer ever recorded in the United States. But when additional data trickled in from outlying stations in Oklahoma, the experts said that state actually beat the Texas heat by 2/10 of one degree. Still, it was the record for heat in Texas. This record was beat by the summer of 2022, which became the hottest on record with an average temperature of 88.1 degrees. In the San Antonio area, 2023 was the hottest summer on record, with an average daily high of 100.2 degrees. And August of 2023 in San Antonio was the hottest month on record, with an average daily high of 103 degrees. One of the expected consequences of climate change is greater extremes and increased variability, with more intense periods of hot and dry weather, and also larger floods. The summertime rainfall and temperature patterns of the last decade or so seem to bear this out. In the graph below, notice how the drought years of the 1950s are clustered rather close together. More recent years show a greater degree of variability, with a tendency toward much hotter and drier summers. For example, note that 2007 and 2009 are at opposite ends of the spectrum, with 2007 being the wettest summer on record and 2009 being one of the hottest and driest. In more recent years, both 2020 and 2022 were some of the hottest and driest, and 2023 was THE hottest and driest. But in between is 2021 which was comparatively wet and cool. All of this suggests increasing variability.
Most regional water planners use the "drought of record" of the 1950s as the basis for development of adequate new supplies, but a study sponsored by the Guadalupe-Blanco River Authority suggests that more severe droughts have occurred. In 2006 the GBRA commissioned the University of Arkansas Department of Geosciences Tree-Ring Laboratory to reconstruct historical climates for the south Central Texas and Edwards Plateau regions, pushing back knowledge to 1648. The study concluded the worst drought on record started in 1708, and several others were worse than the 1950s drought. Head researcher Malcolm Cleaveland said "It would appear unwise for civil authorities to assume that the 1950s drought represents the worst-case scenario to be used for planning purposes." You can get the study here. In 2009 the GBRA prepared a video clip on their tree-ring study and you can view it right here: For much more on drought, why we have them, and what we can expect in the future, see "Drought" by Dr. Todd Votteler, an article originally published in Texas Parks & Wildlife and now available here. Annual Distribution of Rainfall In the chart below, the rainfall peak for San Antonio in May-June is mostly associated with late-spring cool fronts that battle it out with moist tropical air masses from the Gulf and the Pacific, producing thunderstorms. The secondary peak in September-October is mostly associated with tropical cyclones and hurricanes.
On average, May is supposed to be the rainy month; however, May rainfall is also highly variable. The chart below shows how widely rain totals for May can fluctuate from year to year. The year 2003 experienced the driest May on record, with only 0.12 inches of precipitation, and 2013 saw the second highest May total, surpassed only by 1935.
When the rains in May and June do not come, the lack of new recharge water and the geology of the Aquifer combine to have huge impacts on water availability for the region. It all has to do with movement and pressure and the locations of the spring openings. The limestone Edwards Aquifer is not like a sand aquifer, where water forms a stationary dome and stays in place for many years. Water in the Edwards moves toward the major spring openings. As geology would have it, the spring openings are located very high up in the limestone formation. On the graphic below, note how almost all the Aquifer formation is below the red line drawn at the approximate elevation of the spring openings in New Braunfels and San Marcos. To get to the openings, water has to go uphill. They say water doesn't flow uphill, but it will if it's under pressure! And water pressure within the Aquifer is what forces water out of the springs. When new water enters the Aquifer in the recharge zone, its weight places pressure on water already deep inside and forces water out through distant springs. As long as enough hydraulic pressure exists to force water up to the level of springs, significant amounts of water will flow out (changes in pressure are reflected in rising or falling well levels and are monitored at the J-17 index well for the San Antonio Pool). But since the springs are located high up in the formation, it doesn't a large drop in pressure before there is no longer enough to force water out through spring openings. Shortly after it stops raining, only small amounts of new water are entering the Aquifer, so there is less new water applying pressure at spring locations. And when it stops raining demand increases, so there are many wells pumping and intercepting some of the pressure that would otherwise be exerted on spring openings. The bottom line is that no rain means no pressure at spring locations and flow at Comal and San Marcos springs is reduced, sometimes to the point where endangered species are threatened. When the spring and early summer rains fail, we face a long dry summer that is also our peak demand period, and we can quickly get in situations where water restrictions have to be imposed if the springs are to flow and endangered species are to survive. In addition to the endangered species, there are cities and industries downstream that depend on springflows, and also huge regional economies such as recreation and commercial fishing along the coast.
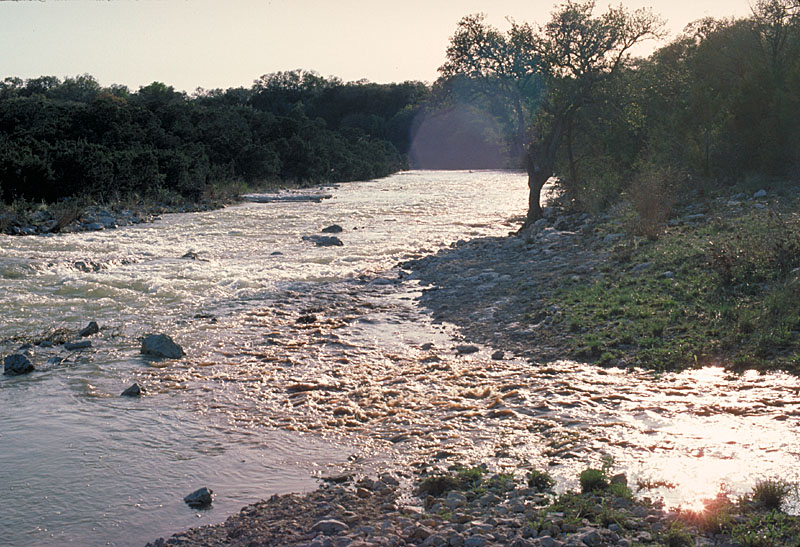
Since rainfall is so variable, and since the Aquifer does not hold much water above the level of springs for use tomorrow, the region seems to always be either water-rich or water-poor. When there is water, EVERYone has water, but when it is dry, EVERYone is dry. It seems very likely this situation would still persist even if we built major artificial recharge projects. They could help us in a short-term drought of 1-2 years, but in a long-term drought they would provide little benefit because there would be very little water to recharge. Actually, there are various opinions about whether we live in a "water-rich" region or not. Some people argue the Aquifer contains enough water to supply our needs for several hundred years, even if never rained again, and they propose managing the Aquifer as a reservoir. The idea is that we could draw the Aquifer down in dry times as much as we need to, and then let it fill back up when the rains come. This is certainly the approach that water managers use to get the maximum benefit from a surface water reservoir. Detractors from this approach argue that it involves misleading word-games. They concede it is true that when all the springs stop flowing the aquifer is still 90-95% full, but they argue it is misleading to suggest the Aquifer contains enough water to supply the region for several hundred years. They point out that as long as we are going to maintain at least minimal natural springflows for the sake of endangered species, downstream ecosystems, and recreational interests, then in practical terms the large amount of water below the level of the springs is unavailable to us. It's also unavailable to us in legal terms, since the federal judges have said the springs must flow. And they argue that even if we did decide to let all the springs go dry and pump out as much water as we need, it is very expensive to pump large amounts of water up from great depths. Moreover, there is a practical limit on how deep pumps can be placed in wells. The images below show what the area looks like when EVERYone has water. One problem is that when surpluses are available, we have no place to store them for later use. And it seems highly unlikely that any more large surface water reservoirs will be built. Environmental concerns would be many, and landowners would fight tooth and nail against sacrificing their beautiful river valleys to slake San Antonio's thirst. A comprehensive 50-year water plan recently submitted to the State by South Central Texas Regional Water Planning Group does not include any major new surface water reservoirs for the region. However, a large water storage project was completed in 2004 when the San Antonio Water System brought their Aquifer Storage and Recovery Project online.
|
||||||||