|
|
Hydrogeology of the Edwards Aquifer
Formation of the Edwards Aquifer
The key to why the Edwards is a good aquifer lies in the fact that the limestone was exposed, extensively eroded, and then covered over again with new limestone formations. When the Edwards limestone was exposed, erosion created cavities and conduits and made the limestone unit capable of holding and transmitting water. When it was covered over again, the new sediments were relatively impermeable and formed a confining unit. The story of how the Aquifer formed begins a long time ago...
Present Hydrogeology of the Edwards Aquifer After the Buda and Eagle Ford groups of limestones were deposited on top of the Edwards formation, the Tertiary and Quaternary periods of the Cenozoic era (beginning about 70 million years ago) saw the rejuvenation of the Rocky mountains by activity of tectonic plates colliding and overriding. During this time millions of tons of sediments were being deposited by wind and water across Texas. The thickness of these sediments increases towards the coast, and their tremendous weight caused a series of parallel faults to form between the Edwards Plateau and the Gulf. The limestone layers that had been laid down flat became tilted, forming narrow bands at the surface. This is the geology we have at present (see Figure 4). The Edwards limestone is between 300-700 feet thick, outcrops at the surface in a narrow band, is tilted downward toward the south and east, and is overlain by younger limestone layers and thousands of feet of sediments. Some aquifers, such as those composed of sand or gravel, are relatively uniform throughout and so are called homogenous aquifers. But the Edwards is actually a group of limestones, each with different characteristics, so it is not homogenous at all - it is a highly heterogenic aquifer. Figure 4 is a cutaway view of the Edwards Group near San Antonio. Note how the Edwards limestone outcrops at the surface north and west of San Antonio and then plunges deep under the city toward the south and east.
The Balcones Escarpment is the topographic expression the Balcones Fault, the most pronounced of the faults caused by the great weight of sediments being carried onto the limestone plateau. There are actually many complicated faults and fractures, so the Escarpment is also called the Balcones Fault Zone. This zone is where the Gulf Coastal Plains transition into the Texas Hill Country. Vastly different land uses on either side of the Escarpment are evident in satellite imagery. Below the Escarpment is the blackland prairie of the Gulf Coast where agriculture and urban uses are dominant, while above the Escarpment lies the Texas Hill Country where ranching and grazing are common. Displacement of the Balcones is about 1,200 feet. However, one thing that really bothers geologists around here is they don't know whether this displacement occurred all at once, such as during a powerful earthquake, or over a long period of time. Property on the Balcones Escarpment, especially where it runs through northern San Antonio and western Austin, is highly valued for its rugged Hill Country beauty and lovely views of the city lights. Figure 5 shows a typical hydrogeologic dip section. This one runs from northwest to southeast through San Antonio. The Edwards limestone is divided by faults into units, and some of the faults have caused enough lateral displacement so that the Edwards limestones are not connected. These are called barrier faults. For more on the many faults of the Edwards system, see the section on Faults and Caves.
Figure 6 shows another dip section through the artesian zone of the Aquifer from Brackettville to Kyle. Again, notice the large number of faults that disrupt the continuity of the Edwards group of limestones.
The Cretaceous sratigraphic units are diagrammed below:
In general, the movement of groundwater in the freshwater part of the Aquifer is from areas of higher elevation in the southwest toward major discharge areas in the northeast. The flow pattern is controlled primarily by the locations of barrier faults that disrupt the continuity of the permeable Edwards strata. Displacement between layers of permeable strata ranges from very small, so they can exchange water, to very substantial so that permeable and impermeable layers are juxtaposed. The presence of many faults and fractures makes the flow patterns highly complex. Groundwater divides exist in the west near Brackettville and in the east near Kyle, so the San Antonio segment of the Aquifer has long been though to be hydrogeologically separated from Edwards limestones on either side. For example, Barton Springs in Austin is also an Edwards water feature, but because of the groundwater divide near Kyle waters in that portion of the Aquifer do not readily mix with waters in the San Antonio segment. This is why the Barton Springs portion of the Aquifer was not included in the jurisdiction of the Edwards Aquifer Authority when that agency was created in 1994. But in April 2010, a study commissioned by the Guadalupe-Blanco River Authority found that groundwater level data indicates the groundwater divide dissipates and no longer hydrologically separates the San Antonio and Barton Springs segments during major droughts and with current levels of pumping. As a result, there is potential for some groundwater to bypass San Marcos Springs and flow toward Barton Springs during major droughts. See the complete study.
Because the movement of water in the Aquifer is highly complex, the waters we pump from the ground and drink are a mixture of waters of many different ages. In some places water moves only a few feet a day, but in other places water may move 1,000 feet a day or more (Maclay, 1981 and Ogden, 1986). Some of the water we drink today is very old, but some went underground just recently. It can spend up to several hundred years underground before it emerges at a well or a spring, so some of the water being used today likely went underground around the time that Texas was struggling to gain independence from Mexico. It is the structural characteristics of the limestone that cause such a wide range in water age. There are two structures - a matrix, and conduits. Almost all of the water storage occurs in the matrix, and most of the water movement occurs in conduits. There are many large caverns, but one should not picture the underground reservoir as a vast pool. Rather, think of it as a saturated sponge with pipes. The rock matrix has many pore spaces similar to the holes in a sponge, and some of them are connected by well defined conduits through which water can readily flow. Pores that are not connected to other pores or to a conduit cannot provide much water. Having pores that are connected is called conduit porosity, and a measure of how many pores are connected and can provide water is called effective porosity. There are many sinkholes in the Edwards region, and for this reason it is often referred to as a karst aquifer. However, having sinkholes is not the defining characteristic of karst, rather; conduit porosity is the true defining characteristic of karst (Ewers, 2010), and the Edwards has plenty of that. Dye tests in the Edwards usually reveal high hydraulic conductivities and velocities, so while the average residence time is high, there are places and flowpaths where water enters and then leaves the Aquifer very quickly. In 2011, researchers estimated that water pumped from a public supply wellfield on Wurzbach Road near Loop 410 had an average age of about 4 years, and some of it was up to 342 years old (Eberts, 2011). The large proportion of young water in this wellfield points up the need for protection of recharge water quality. The Aquifer has a tremendous capacity to stabilize organic wastes and other pollutants; in fact, San Antonio is the only major city in the world that does not have to treat water before distribution. But in some places the water may not stay underground long enough for the natural treatment processes to proceed, and the ability of the system to purify water may be overwhelmed or disrupted by excessive inflows of pollutants.
Water enters the Aquifer easily in the recharge zone, but the subsurface drainage is generally inadequate to hold all the water that falls in large rain events. Recharge conduits and sinkholes quickly become filled up with water. This is one reason why the region floods so easily. Compared to other types of aquifers such those composed of sand, the Edwards is not an especially good storage Aquifer where water can be placed and expected to stay in storage for use later. Transmissivity is high enough that as long as enough hydraulic pressure exists to force water up to the level of springs, significant amounts of water will flow out. We can artificially increase recharge to the Aquifer when water is available and it might help us get through a short-term drought of 1 or 2 years. But additional recharge probably can't be of much help in a prolonged drought. And droughts DO come - the key to understanding the climate of the region is realizing that rainfall is highly variable (see rainfall chart). Average rainfall means nothing here. Since the Aquifer does not hold much water above the level of springs, and since the rainfall is so variable, the region is constantly in a state of being either water rich or water poor with hardly anything in between (see section on Regional Climate). Dealing with the region's water problems always seems to come back to the issue of having some kind of storage available to put surpluses when they occur. One storage solution that has proven highly successful is the San Antonio Water System's Twin Oaks Aquifer Storage and Recovery project. Changes in hydraulic pressure within the Aquifer are reflected in rising or falling well levels and are monitored at the J-17 index well. The level of the J-17 drops about one foot for each 40,000 acre feet of water discharged from springs and wells. During peak pumpage periods in the spring and summer the level can easily fall over one foot per day. When the level of the J-17 well gets below about 650', the rate of decline slows and no one really understands why. One theory is there is much less volume of saturated rock at higher elevations, so pressure drops quickly when recharge rates are low, while the volume of rock at lower elevations is very large and sufficient to maintain pressure after an initial rapid decline. Hydrologists like to describe artesian aquifers in terms of a potentiometric surface, which can be pictured as a plane to which water will rise in wells under pressure. This is usually determined by evaluating water levels in a number of different wells, then drawing a plane between wells at the elevation to which water rose. This is very useful for figuring out how deep you will have to drill wells and where to put your pump. But the potentiometric surface is not especially meaningful or useful in karst aquifers like the Edwards. It works well for homogenous aquifers, but in the Edwards every well is different and you could never drill enough of them to truly define the potentiometric surface (Ewers, 2010). Theoretically, there is enough water in the Aquifer to supply the region for more than 100 years, even if another drop of rain never fell. In reality, only a small portion of that water is available to us. In total, the Aquifer may hold between 25 and 55 million acre feet (Maclay, 1989). However, most of that water is not available in legal or practical terms. Springflow depends on the upper five to ten percent of the formation, so the Aquifer is still 90-95% full when all the springs run dry. But even if we were not concerned with maintaining springflows for endangered species, recreation, and downstream interests and we were free to draw the Aquifer down below its historic low, the level would eventually get so low that it would become prohibitively expensive to pump water out. In the long run, we cannot use more water from the Aquifer than what goes into it. A sustained overdraft will result in a mining of the resource. The Knippa Gap and Pools Within the San Antonio Segment A constriction known as the "Knippa Gap" separates a pool of water under central Uvalde county from the San Antonio pool under Medina, Bexar, and Comal counties. Maclay and Land (1988) described the Knippa Gap as a narrow opening within an extensive, complex system of barrier faults. Large amounts of water cannot pass quickly through the gap, so water piles up behind it in the Uvalde Pool, causing water levels in wells west of the Gap to be higher and less variable. In 2006, work by Ron Green and others provided refinement to the structural geologic interpretation in the Maclay model. Like Maclay, they described the Gap as resulting from barrier faults; in addition, a prominent ridge in the base of the Edwards known as the Uvalde Salient reduces the saturated thickness of the Edwards to as little as 400', compared to a saturated thickness of about 600' on either side of the Gap. A series of prominent high points in the ridge constricts groundwater flow through topographic saddles between the high points. Green also noted there is a second factor causing the increased elevation and reduced variability noted in well levels to the west. Just east of the Gap, large amounts of recharge from the Frio and Dry Frio Rivers doubles the amount of groundwater flow. Together, the Knippa Gap constriction and the large volume of incoming recharge cause a damming of groundwater upgradient and to the west of the Gap (Green, et al, 2006).
Green also noted there is an area under Kinney county that probably deserves designation as a separate pool. Previously, it was thought to be part of the Uvalde pool. Green found that a zone of low permeability in western Uvalde county causes limited connectivity between the two pools, and the chemistry of their waters are very different. Why Are the Springs Where They Are? Geologists have noted that most of the major Edwards springs are in the east. San Pedro, San Antonio, Comal, San Marcos, and Hueco Springs are all located in the eastern third of the Edwards region. In the east there are also many more caves, and the recharge zone is thin at the surface. Towards the west, the recharge zone is much wider, fewer caves have been found, and there are no springs approaching the magnitude of those in the east. Why is this? C. M. Woodruff, Jr. and Patrick Abbott have explained the location of springs and the evolution of regional Edwards circulation systems in terms of stream piracy and development in two diverse time periods (Woodruff and Abbott, 1986):
Dihydrogen oxide (H2O) Dihydrogen oxide, more commonly known as water, is a powerful chemical compound and is absolutely essential for life. Water is known as the "universal solvent" because it dissolves so many other compounds. Water also provides the ideal medium in which a great many chemical reactions may take place, such as those necessary to sustain life. In its pure form, dihydrogen oxide is called "lab water" and is not recommended for drinking. Water from the Edwards Aquifer is by no means pure, and it's a good thing! Edwards water contains a healthy mix of ions and trace metals, and the bottom line is that water quality in the Edwards is exceptionally good. Major Ions Water that is absolutely pure has a tendency to leach minerals from bones and has a variety of other unhealthy effects. It is desirable to have the right concentration of ions. Drinking water is usually buffered with ions of calcium or magnesium, lots of which are found in Edwards water. Other naturally occurring ions that are commonly found are sodium, potassium, sulfate, chloride, fluoride, and silica. Below are the typical range of concentrations for some of the primary ions found in the freshwater zone of the Edwards. 'BMDL' stands for Below Method Detection Limits and indicates the concentration was somewhere below the lowest level that could be detected by the test.
Metals In the metals category, Edwards water contains a host of naturally occurring elements such as iron, copper, and zinc, all of which usually occur well below drinking water quality standards. When concentrations are detected above drinking water standards, it is usually in monitoring wells near the fresh/saline water interface, not public water supply wells. It is to be expected that metals concentrations would exceed drinking water standards in the saline zone. In 2000 the Edwards Aquifer Authority detected a lead concentration in a public water supply well in Medina County (well TD-68-49-501) that exceeded the standard, and the agency is continuing to monitor that well for any trend of concern. The table below lists the typical range of concentrations for elemental metals found in the freshwater zone of the Edwards. There are three different types of levels against which we compare values for Edwards water. Maximum Contaminant Levels (MCLs) are associated with Primary Drinking Water Standards and are the maximum permissible levels for drinking water delivered to customers. Contaminants regulated by the Primary Standards can cause adverse health affects when maximum levels are exceeded. Secondary Drinking Water Standards are set for constituents that can affect the aesthetic qualities of drinking water, such as color and taste. Copper and lead are regulated by a Treatment Technique Action Level. Public water systems must take steps to reduce the levels through treatment if the maximum is exceeded in more than 10% of tap water samples.
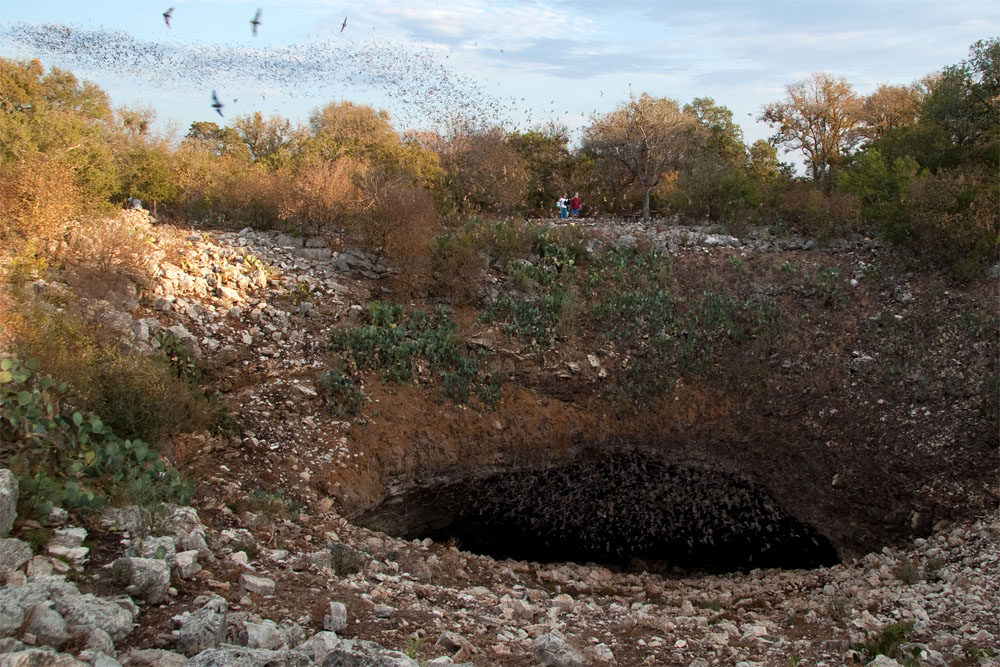
Nutrients Some Edwards wells are surprisingly high in nitrates, a nutrient that is regulated in drinking water because it can produce "blue baby" syndrome in very young children by interfering with oxygen transport in the bloodstream. It is not clearly understood what the source of nitrate is in the Edwards, but there are several possibilities, including agriculture, bats, and natural treatment processes. Since chemical fertilizers have been used in agriculture for many decades, it would not be surprising if some of the nitrates they contain have found their way into Edwards water. Nitrate levels are generally higher around Uvalde, which is a highly agricultural area. Nitrates and the other main nutrient of concern, phosphorous, can also originate in runoff from urban areas. Interestingly, some scientists have suggested that high nitrate levels could originate from bat guano. We know that bats establish colonies in recharge caves and their excrement piles up on cave floors. Bat guano is extremely high in nitrates and can occur in such huge quantities that in the past some caves in the region have been mined as a source of nitrate for making gunpowder. It seems reasonable to hypothesize that in some caves, guano could occasionally be washed down into the Edwards during major recharge events.
An interesting parallel may be drawn between the Edwards and a wastewater treatment plant, where the end product of treatment is nitrates. At a sewer plant, organic materials in raw sewage are first broken down by organisms into ammonia nitrogen (NH3-N). Ammonia nitrogen is then converted by other organisms to nitrite (NO2) and finally to nitrate (NO3), a stable form of nitrogen. When treatment plant effluent is high in nitrates, it is a signal to the plant operator that the treatment process is complete. The Edwards also produces potable water through processes that are similar to a treatment plant (see the section below on treatment within the Edwards). For more on the water recycling process, see the page on that topic.
In 2024, geologist James David Doyle offered another possible source of elevated nitrates in the Edwards: rock quarries. Doyle wrote that surface water flow from the contributing zone, cross-fault flow from the Trinity Aquifer, urban development over the recharge zone, and atmospheric deposition of nitrogen are all insufficient to account for elevated and increasing nitrate levels. According to Doyle, increasing nitrate levels coincided with the large scale use of ammonium nitrate fuel-oil (ANFO) mixtures as explosives in mining operations, and quarry distributions align well the geographic distribution of elevated nitrate concentrations in the Edwards Aquifer (Doyle, 2024). Bacteria Because blind catfish and other creatures occasionally appear in wells, we know there is life in the Edwards, so the water also contains some bacteria and microorganisms associated with aquatic life. Bacteria associated with terrestrial life also have occasionally been detected in Edwards wells. Fecal coliform bacteria live in the intestines of warm-blooded animals and are an indicator that harmful bacteria may be present. They can enter the Aquifer when fecal material from warm-blooded animals like cows and deer is washed in with recharge water. These bacteria can also originate from the thousands of septic tanks over the recharge zone where lightly treated sewage is discharged underground. Bacteria are the reason that water is disinfected (usually with chlorine) before being distributed in public water supply systems. When water is used as a source for public drinking water supplies, the Maximum Contaminant Level is 2,000 colony forming units per 100 ml of water. The typical range of concentration in freshwater Edwards wells is 0-150 cfu/100 ml. Pesticides, Herbicides, Volatile Organic Compounds Since the 1990s, improvements in laboratory analytical methods have given us the ability to detect extremely small concentrations of contaminants. Whereas before we could only see parts per million, now we can easily detect parts per trillion and quadrillion. We live in a world that is suffused with chemicals, so in Edwards water it is not surprising to find extremely small concentrations of almost anything you might go looking for. The Edwards Aquifer Authority conducts an extensive testing program in which many wells are routinely analyzed for pesticides, herbicides, and many of the common chemicals that people use and produce. These are almost always detected at concentrations far below the standards that would cause concern. The same cannot be said for Barton Springs in Austin, which also occur in Edwards limestones that under most conditions are hydrogeologically separated from the much larger and more prolific San Antonio section. At Barton Springs, scientists with the United States Geological Survey have been sampling for pesticides since 2000 and have regularly detected them at low concentrations during baseflow conditions, and a larger suite at much higher concentrations just after rain events. In January 2003 the pool was closed for 90 days for environmental testing after the Austin American-Statesman reported that high levels of arsenic and seven benzene-based compounds were found in the pool and upstream on a hillside overlooking Barton Creek. The pool has also been closed several times because of bacteria concerns. Many regard the water quality problems at Barton Springs as a warning to other regional users of what will happen if Edwards recharge quality is not adequately protected. For more on the occurrence of soluble pesticides in Barton Springs see the USGS page by B.J. Mahler and P.C. Van Metre. In April of 2004, high levels of perchloroethene (PCE) were found in a small private well near Bandera Road in Leon Valley. PCE is a volatile organic compound that is a known carcinogen and is regulated in drinking water. TCEQ officials suspected the PCEs were associated with a dry cleaning operation and had entered the Aquifer through an abandoned or improperly constructed well. There was no evidence that nearby municipal supply wells were affected. It was subsequently declared to be an EPA Superfund site, and in July of 2011 EPA officials held a series of public meetings on proposed cleanup options. Conservative cost estimates ranged from $7 - $15 million. Does the Edwards act as a filter? Expert hydrologists and water agencies are often quoted as saying the Aquifer does not filter water. This assertion deserves some exploration. According to Webster's dictionary, a filter is
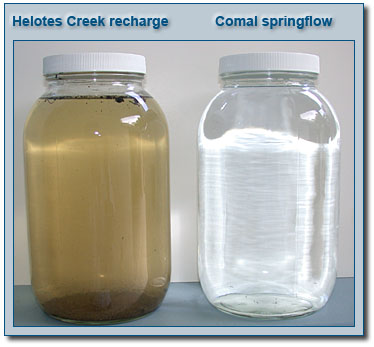
In the field of water treatment, a filter is usually composed of paper or sand, where pore spaces are small enough so that water will pass through but small suspended particles will not. The Aquifer is not what people in the water resource field traditionally think of as a filter. However, there are many pore spaces within the Aquifer that are so small that suspended particles cannot pass through. In this sense, and according to a strict definition, the Aquifer is indeed a filter and does provide some filtration. The photo below shows a sample of stormwater runoff collected from Helotes Creek in the recharge zone, and another sample taken from Comal Springs on the same day. The recharge water is discolored and murky, there is a layer of sediment that has settled at the bottom of the jar, and there are floating solids on top (mostly leaves and sticks). Meanwhile, the sample collected from Comal Springs is crystal clear. Obviously, the water that emerges at springs is not the same quality as water that goes into the Aquifer in the recharge zone. Something is happening that results in much cleaner water coming out. So while a semantic debate can proceed about whether or not the Aquifer acts as a filter, what is clear is the Aquifer definitely provides treatment. In the section below we will take a look at how this occurs.
Natural Treatment Within the Aquifer Dilution Although it is not really a treatment method, dilution is the first thing that begins to transform muddy water to crystal clear spring water. The murky sample above was collected during a storm event while runoff from streets and developed areas was actively entering the Creek. During very wet times, water enters recharge creeks after being filtered through the surrounding banks. Such water can establish a temporary flow in normally dry creeks, and it is of much higher quality than the brown stormwater that enters while the rain is actually falling. In Helotes Creek, for example, the water usually becomes very clear a day or so after a storm event and continues to flow for several days or even weeks. Settling One of the most common methods of water treatment is called clarification, or settling. The Aquifer provides treatment by acting as a large settling tank. Rapidly moving water, such as the water racing down recharge streams during storm events, carries sediment and debris. When recharge water enters the Aquifer it slows down and the sand and dirt and organic materials it carries begin to settle out (as in the jar above). Divers in the Edwards have reported that underwater cave floors are covered with a thick layer of silt that is easily stirred up, causing a blinding "silt-out" in the normally crystal clear waters. Biological activity Very little is known about the biological activity that occurs in the Edwards. In conventional wastewater treatment, however, biological activity is a key component of turning sewage into recycled water (see the page on wastewater recycling). Solids that are dissolved or otherwise will not settle out are transformed by bacteria and microorganisms into material that will indeed settle, resulting in purified water. Although not much is known, it is clear that biologic activity is occurring within the Aquifer and neutralizing organic material. There are many types of aerobic bacteria that will do their work wherever there is organic material and sufficient oxygen. These bacteria survive in the water column, where oxygen is present. In the sludge layer that accumulates at the bottom of underwater caves and conduits, anaerobic bacteria work to stabilize organics. Protection of recharge water quality is important because anti-freeze, motor oil, pesticides, herbicides, and any other chemical that is toxic to life can disrupt the natural biological purification processes that are taking place in the Aquifer. Natural Degradation Within the Aquifer While the Edwards provides natural treatment of the water inside, there is also natural degradation. Water is a powerful dissolving agent and as water moves along through the limestone, it continually dissolves mineral solids from the surrounding rock. When the concentration of total dissolved solids (TDS) becomes greater than about 1,000 ppm, the water is considered saline and not drinkable. The "bad water line" is a natural phenomenon that occurs along the southern and eastern edges of the fresh water zone where water has been in contact with limestone for a long time. It is actually a zone, not a line. Water movement is slower here, so the water stays in contact with limestone longer and becomes more saline. Values for a typical analysis of water quality in a fresh water and a saline water well are listed below:
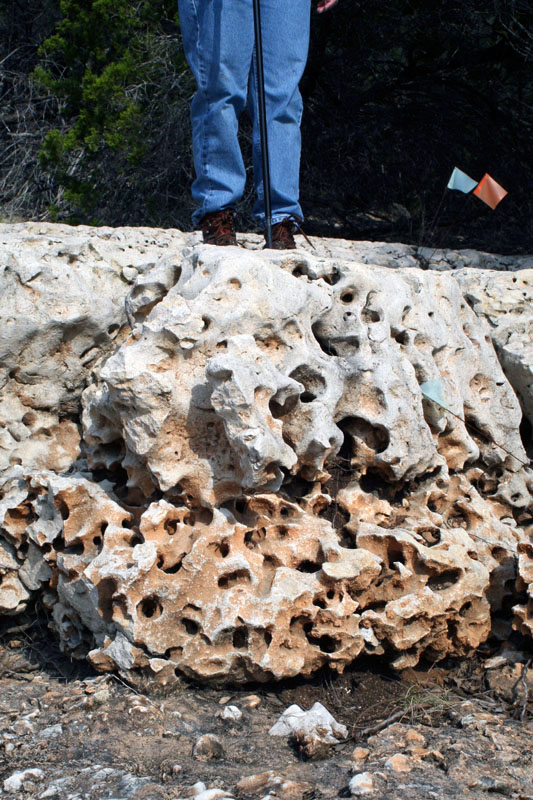
Users of the Edwards Aquifer are lucky because no major water quality or pollution problems have been experienced YET. In San Antonio there is little heavy industry and not much potential for serious degradation. Although there is a Superfund site in Leon Valley and there have been other isolated instances of pollution, we have not yet experienced any widespread problems. Currently, Edwards water does not require treatment before distribution, other than disinfection by chlorination. To keep the water clean for future generations, however, vigilance in protecting the Recharge and Contributing Zones will be necessary. Once water in the Aquifer becomes contaminated, it will be very difficult and perhaps impossible to clean. The only alternative might be to treat water by conventional means after it is pumped to the surface, an expensive proposition that most cities other than San Antonio have already had to invest in. In most cities, water is drawn from a river or reservoir, treated in a central location, and sent to customers over a wide area through very large distribution mains. In San Antonio, there are many Edwards wells all over the city where water is pumped out, stored in tanks, and distributed mainly to the local area. There are no large conveyance systems and there would be no way to move large amounts of water from a central treatment facility if it became necessary. Instead, there would probably have to be a large number of smaller treatment facilities located close to pumping centers, which would be more expensive to build and operate. If it became necessary, the cost for treating Edwards water would be a very big number indeed. Whatever that number is, that is the value of the treatment the Aquifer is currently providing for free. The first rules to protect the Edwards were issued by the Texas Water Development Board in 1970. Since then, the TCEQ and the EAA have also developed rules. Most observers agree all the existing rules are woefully weak and inadequate. In 1995, San Antonio enacted its first rules and guidelines for development over the Recharge Zone. But developers had plenty of heads-up time and were grandfathered to develop in the old fashion as long as they filed a plat before the rules went into effect. The result was that large sensitive areas in northwest Bexar county were developed without meaningful protections. In any case, only 2% of the Recharge Zone is within San Antonio's jurisdiction, so more widespread requirements for ecologically sound development are needed. It is also important that people living and working on the Recharge Zone be aware of how the Aquifer can become polluted and refrain from dumping used motor oil, cleaning agents, and other common household chemicals. Since there is a well-established scientific link between development and runoff water quality, Edwards water quality protection mainly comes down to managing growth and limiting impervious cover. Protecting the Recharge Zone is not enough. It is just as important to protect the quality of water that runs off the Edwards Plateau and ends up as recharge, but Contributing Zone controls receive much less attention. Neither the TCEQ or the EAA has the power to make and enforce rules in most of the Contributing Zone. Builders can do almost whatever they like on sensitive properties adjacent to the Recharge Zone (see photo below). Contributing Zone protections are hugely complicated by the fact that people living on the Edwards Plateau are not Edwards Aquifer users. They do not readily accept the notion of restricting their area's development and implementing rules for the sake of other people's water supply, especially since they perceive that Edwards users have not been especially proactive in managing development over their own Recharge Zone. There is growing evidence that protecting the Contributing Zone is also important because of the hydraulic connections between the Edwards and the Trinity. They are more significant than previously believed, but this is not reflected in current TCEQ rules. See a presentation by Dr. Ron Green on the hydraulic relationship between the Trinity and the Edwards. Meanwhile, there are also significant cultural obstacles to effective water quality management. Texas is a state that is very respectful of private property rights, and many will simply not accept the notion that land use and development should be regulated. On the other hand, a growing number of people don't believe anyone has a private property right to ruin common resources like air and water. However, powerful development interests usually get their way, and so far no lawmakers have been willing or able to take a big-picture view and develop a comprehensive water quality management approach for the Edwards. Texas must eventually find a balance between private property rights and protection of common natural resources. At present, there is simply no institutional or regulatory framework that can effectively protect Edwards water quality. Most of the Edwards Plateau is not within the jurisdictional boundaries of the Edwards Aquifer Authority, and an expansion seems unlikely. Although the enabling legislation of the EAA seems to authorize that agency to implement water quality rules, the legislation's author has said it does not. The issue was hotly debated in the 2003 and 2007 legislative sessions and no resolution was reached. It was not addressed in the 2009 or 2011 sessions. The EAA has several times delayed development of water quality rules because it was concerned such action would result in a private property rights backlash and legislative retaliation. Many contend the Texas Commission on Environmental Quality is the proper agency to regulate for water quality, but so far that agency has not been especially proactive in developing water quality controls, and like the EAA, the TCEQ's authority to apply rules to the Edwards does not extend to most of the Contributing Zone. For a graphic showing jurisdictional boundaries and a more complete discussion of the laws and rules that apply to the Edwards, see the Laws and Regs Page.
|
||||||||||||||||||||||||||||||||||||||||||||||||||||||||||||||||||||||||||||||||||||||||||||||||||||||||||||||||||||||||||||||||||||||||||||||||||||||||||||||||||||||||||||||||||||||||||||||||||||||