|
|
Introduction to the Edwards Aquifer
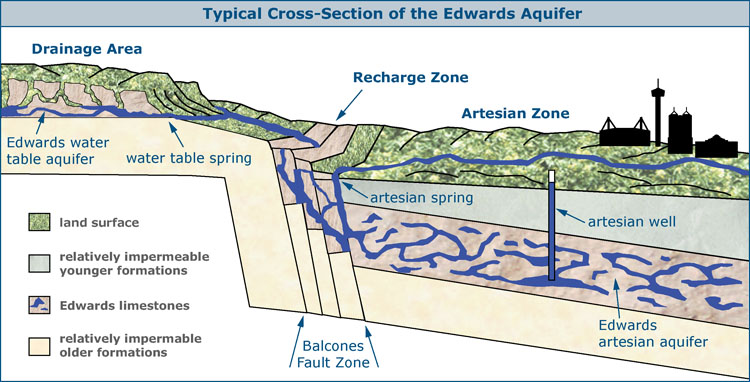
The Edwards Aquifer is an underground layer of porous, honeycombed, water-bearing rock that is between 300-700 feet thick. It includes the Edwards and some associated limestones. The San Antonio segment of the Aquifer extends in a 160 mile arch-shaped curve from Brackettville in the west to near Kyle in the northeast, and is between five and 40 miles wide at the surface. At these two locations, groundwater divides separate the San Antonio segment of the Aquifer from other Edwards limestone units, so their waters do not readily mix during wet and normal hydrologic conditions. The Barton Springs segment extends from Kyle to south Austin (see map above). The San Antonio segment is where most of the major natural springs occur, where much of the use by humans takes place, and where the issues are most hotly-debated. A few major Edwards water features like Barton Springs and San Felipe Springs occur on the other sides of the groundwater divides, to the north and west of San Antonio portion. We are learning more all the time about the extent of the San Antonio segment and the connectivities between segments and other aquifers. There is new evidence that the portion of the Edwards in Kinney county is actually a separate pool, and also new research suggests the Barton Springs may not be so separate after all. In addition, new studies have shed light on the connections between the Edwards and the Trinity Aquifer, which is the major source of water for the Hill Country. The image below shows a typical cross-sectional view of the Aquifer:
The Aquifer is divided into three main zones: the contributing zone, the recharge zone, and the artesian zone. The contributing zone occurs on the Edwards Plateau, also called the Texas Hill Country. It is about 5,400 square miles, and elevations range between 1,000 and 2,300 feet above sea level. The rugged, rolling topography is covered with thick woodlands of oak and cedar. Today, the Edwards Plateau bears little resemblance to the prairies the pioneers to the area saw, but it is home to several endangered species and is itself the subject of increasing environmental concerns. The contributing zone is also called the drainage area or the catchment area. Here the land surface "catches" water from rainfall that averages about 30" per year, and water runs off into streams or infiltrates into the water table aquifer of the plateau. Runoff from the land surface and water table springs then both feed streams that flow over relatively impermeable limestones until they reach the recharge zone.
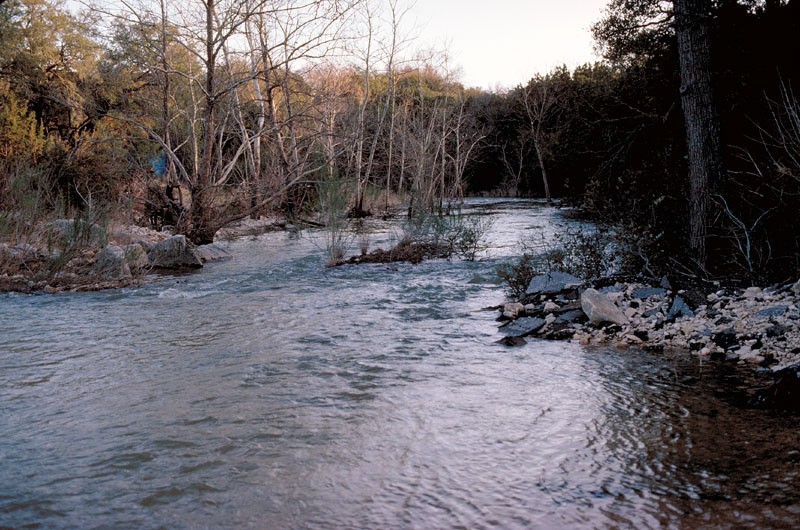
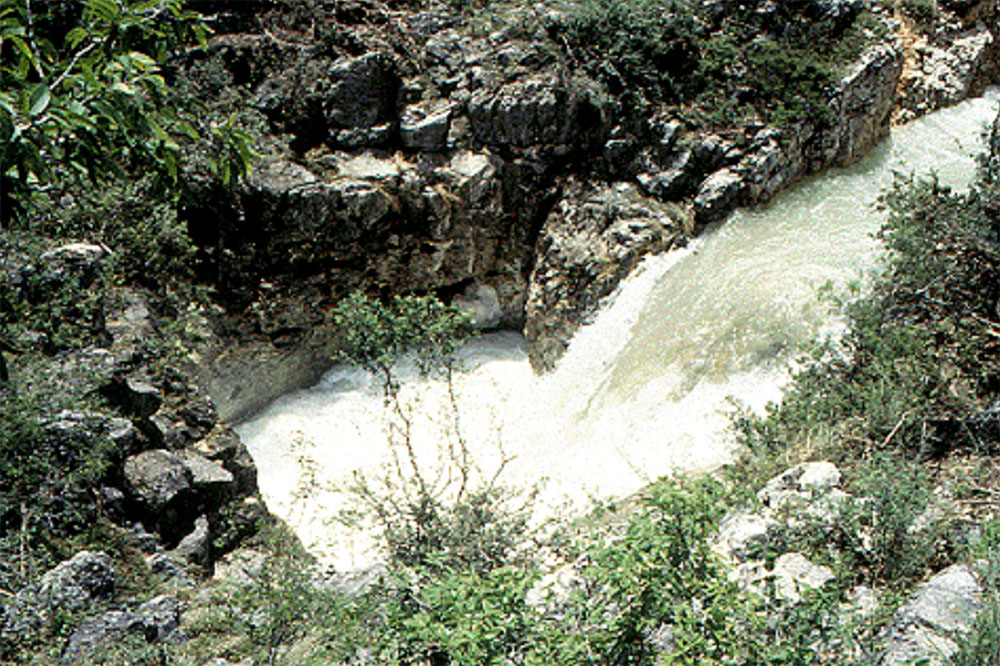
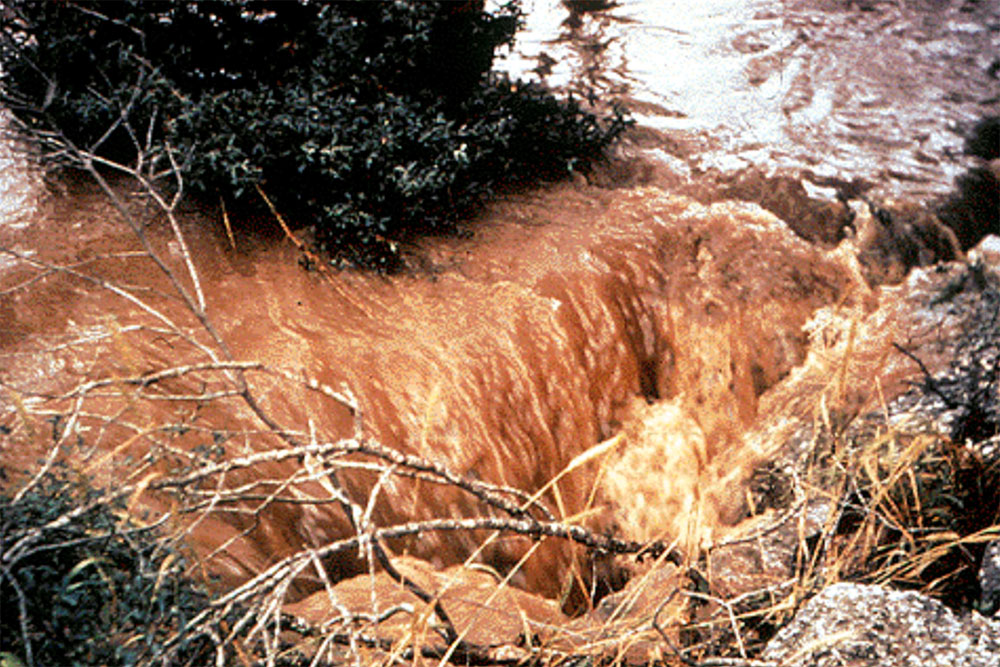
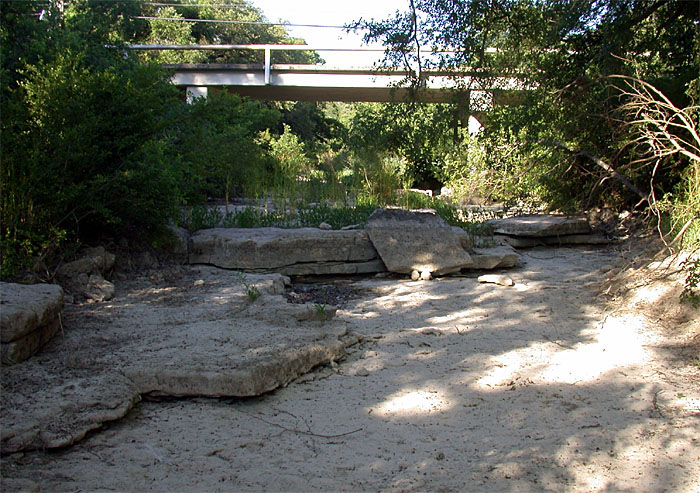
It is not uncommon for the Cibolo to flow 30 feet wide and a foot deep and, in the space of a quarter mile, disappear completely into the Edwards formation.
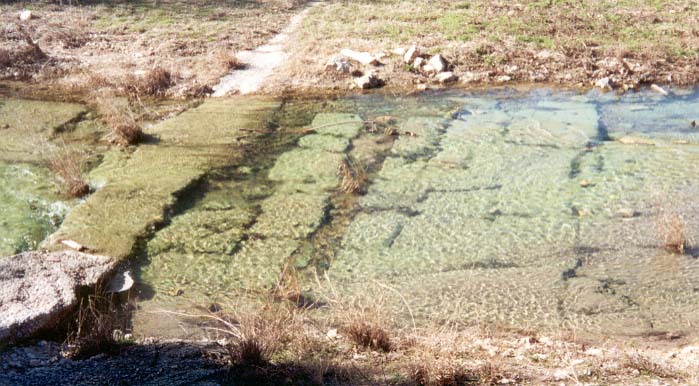
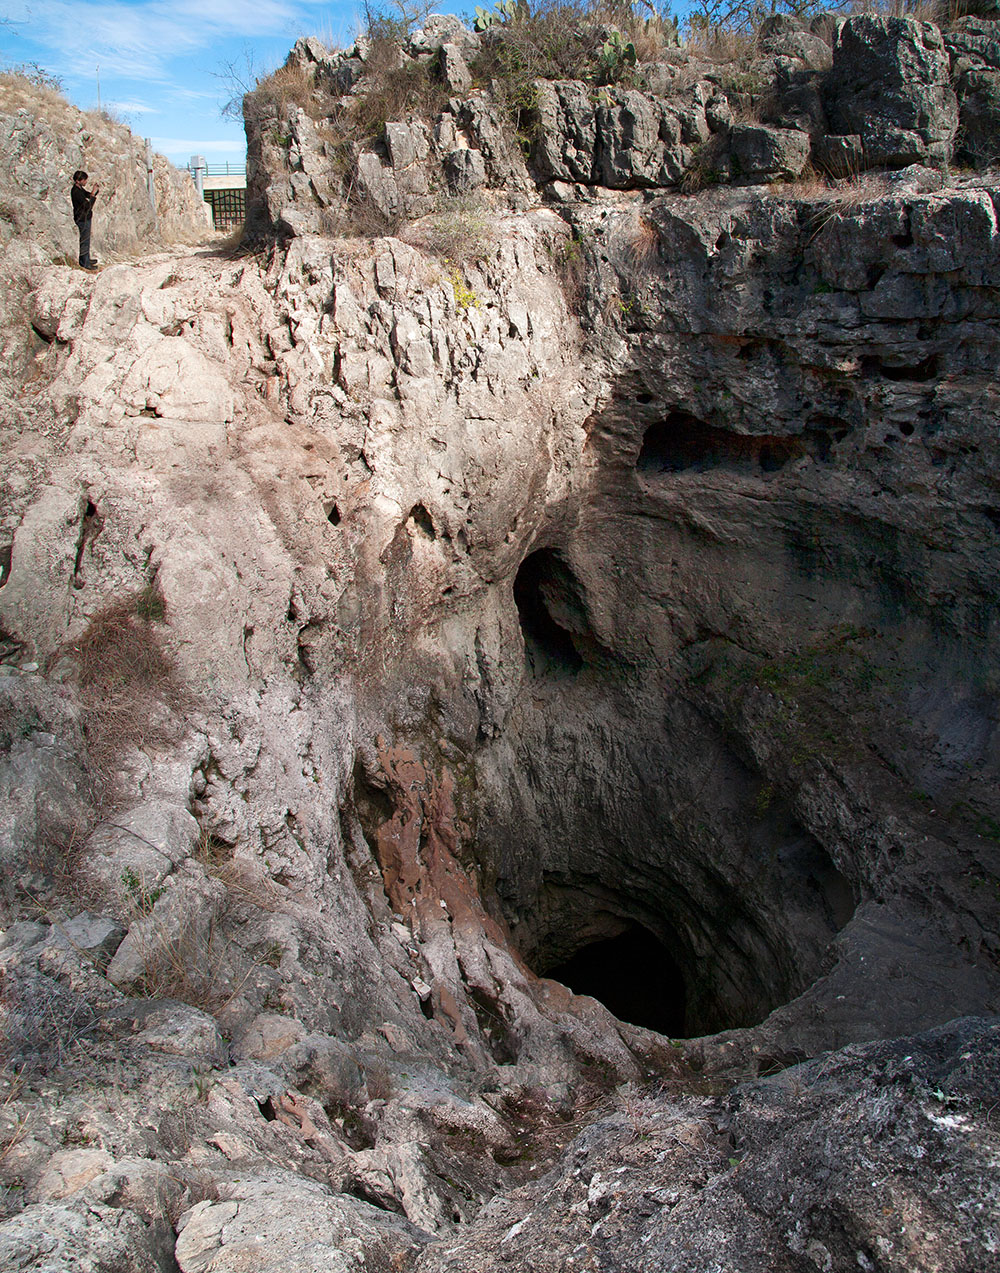
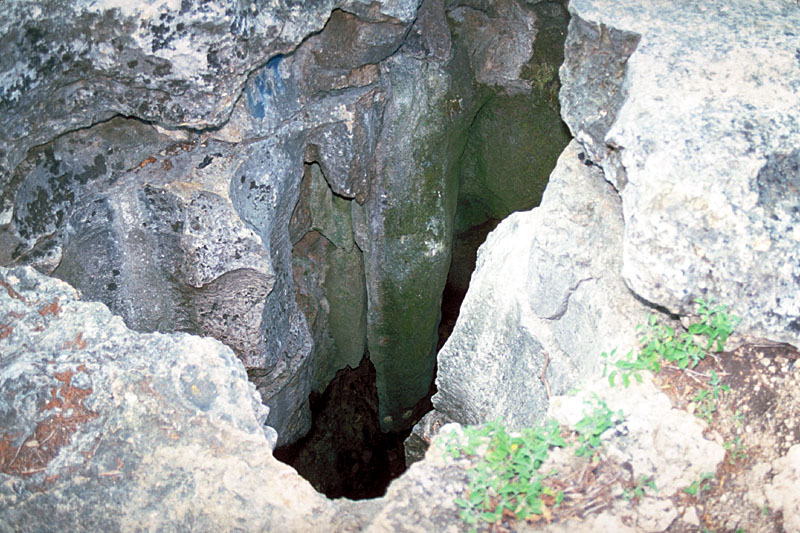
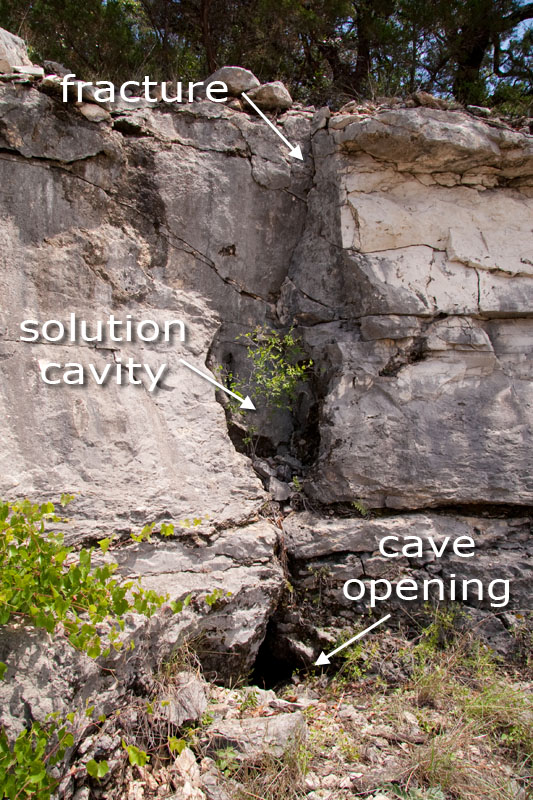
The recharge zone is a 1,250 square mile area where highly faulted and fractured Edwards limestones outcrop at the land surface, allowing large quantities of water to flow into the Aquifer. For this reason, the Edwards is often called a fault-zone aquifer (see section on Faults & Caves for fault map and photos). About 75-80% of recharge occurs when streams and rivers cross the permeable formation and go underground. This is called allogenic recharge. Most of the remaining percentage of recharge occurs when precipitation falls directly on the outcrop. This is called autogenic recharge. A surface water reservoir built partly on the recharge zone, Medina Lake, contributes large amounts of water to the Aquifer. Also, some recent models suggest that significant amounts of recharge enters the Edwards from the Trinity aquifer, perhaps as much as 10% of the annual total. Most of the annual average recharge of about 683,000 acre feet (for the period 1934-2023) occurs in the western counties of Medina and Uvalde, where the Edwards outcrop is very wide at the surface. But rainfall is highly variable and so recharge amounts also vary widely from year to year (see Charts). In the recharge zone there are no other rock formations overlying the Edwards - it is exposed at the surface. So the Aquifer here is "unconfined" and has a water table that rises and falls in response to rainfall. However, the major portion of the Edwards, the artesian zone, is confined between the Glen Rose limestone and the Del Rio clay, and it has no water table (see graphic below).
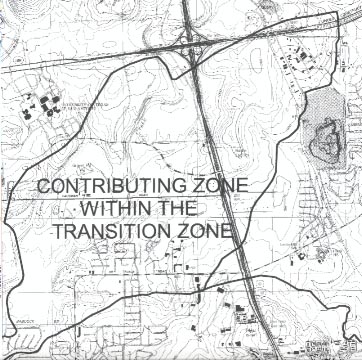
Contributing Zone Within the Transition Zone
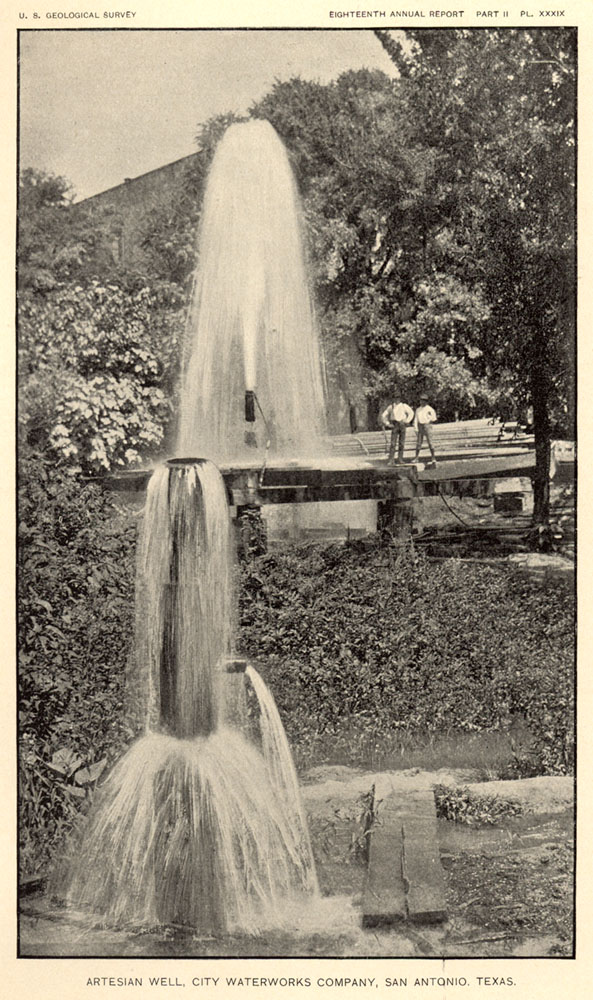
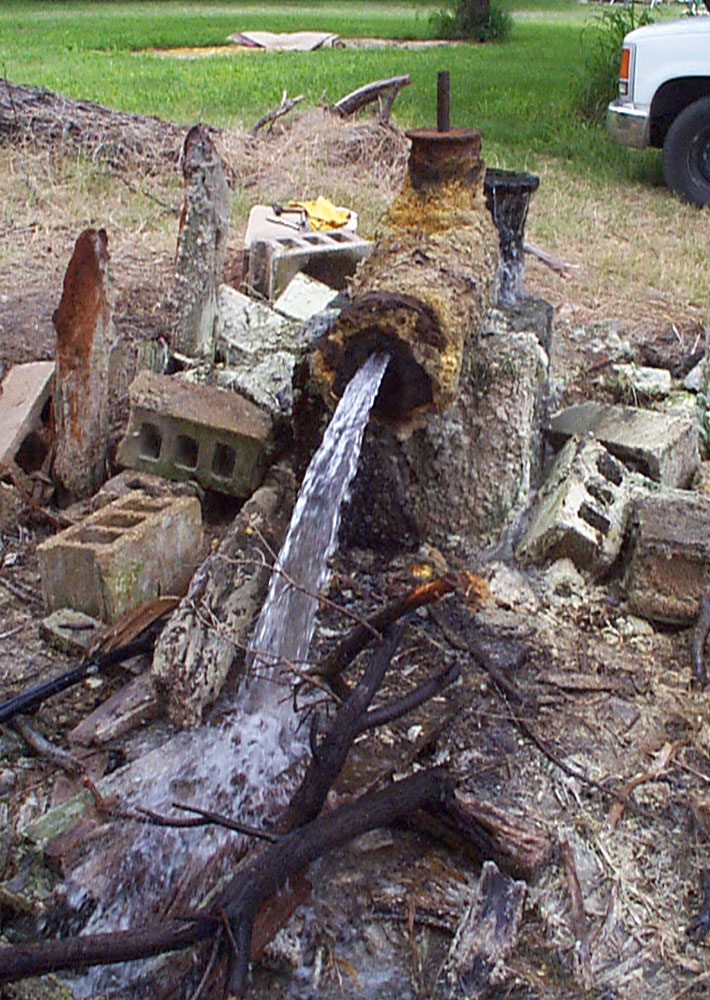
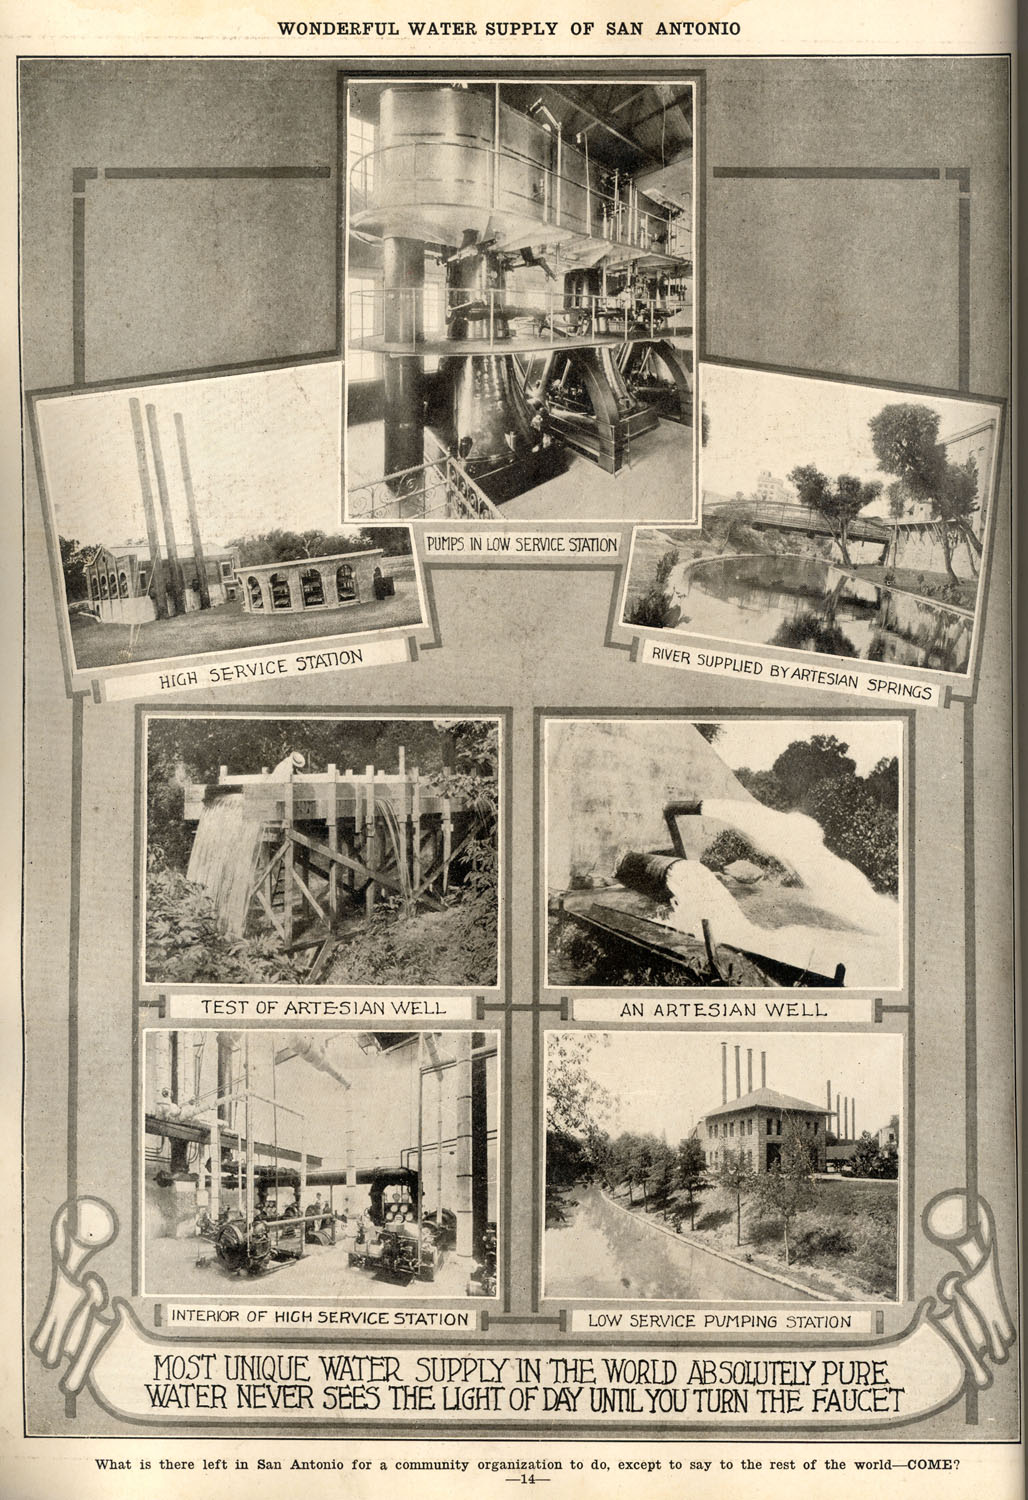
Once recharge water works its way by gravity down into the artesian zone, there are other rock formations lying over the Edwards, and water is trapped inside. The artesian zone of the Edwards is confined between two relatively impermeable formations - the Glen Rose formation below and the Del Rio clay on top. The sheer weight of new water entering the Aquifer in the recharge zone puts tremendous pressure on water that is already deeper down in the formation. Flowing artesian wells and springs exist where hydraulic pressure is sufficient to force water up through wells and faults to the surface. Major natural discharge occurs at San Marcos Springs and Comal Springs in the northeast. San Antonio Springs and San Pedro Springs in San Antonio are dry most of the time because large amounts of water are pumped from the ground by users in Bexar county, but they flow when Aquifer levels are very high. Water moves generally from southwest to northeast through the Aquifer (see Flowpath Map), and there are a number of barrier faults that make it difficult for waters in the various units of the Aquifer to mix together. These faults, along with varying porosities and permeabilities of the limestone, control the movement of water in the Aquifer. The J-17 index well is used to monitor the amount of pressure that water in the artesian zone is under. Changing pressure is reflected in rising or falling well levels.
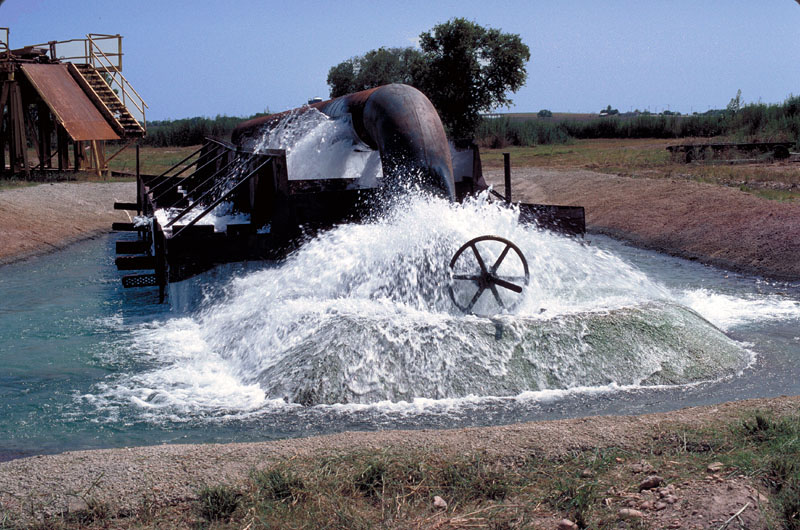
Want to find out what zone of the Aquifer you are in? Check out the TCEQ's Edwards Aquifer Map Viewer Water Table (Recharge) and Artesian (Confined) Zones A water-table aquifer is one in which the water is under atmospheric pressure. Water will not rise above the level of the "table", and the table rises and falls in response to rainfall and recharge. Only a small portion of the Edwards is a water-table aquifer. The water-table portion of the Edwards is the recharge zone, where the Edwards limestone is exposed at the land surface. Here, because there are no confining rock layers on top of the Edwards, the water is under atmospheric pressure. Water will not rise in a well above the level of the water table. There may be an upper zone of unsaturated rock. Most of the Edwards is an artesian aquifer, in which water is under pressure. In the confined or artesian zone, layers of impermeable rock overlie the Edwards limestone, trapping water inside with no easy way out. Just as diving to the deep end of a pool causes you to notice the pressure in your ears, the sheer weight of new water entering the Aquifer in the recharge zone causes water deeper down to be under great pressure. If water can escape through a well or through a spring opening, it will do so, rising above the top of the limestone formation. If there is sufficient pressure, water will rise all the way to the land surface and gush out in a huge volume. In this zone, all of the limestone is saturated at all times, and there is no rising and falling water table, only rising and falling pressure. New water entering in the recharge zone instantaneously exerts pressure on the entire system, so rainfall can cause rapid rises in well levels far distant from the rainfall itself. A good monitoring well is one that is very responsive to rainfall and pumpage, in a location where there is never enough pressure such that water will rise all the way up and flow out on the land surface (so there is always a well level to measure). The J-17 is one such well, and it is used to monitor Edwards pressure in the San Antonio pool. The well is on a major flowpath and quickly reflects rising and falling pressure. J-17 levels and springflows rates are used to trigger drought restrictions and pumpage cutbacks during dry times.
The fresh water / saline water interface, usually known as the "bad water line" is the convergence of two flow systems within the Aquifer. It is actually a zone and not a line. The freshwater area is generally updip, closer to the land surface; while the saline water area is farther downdip, deeper underground. In the freshwater portion of the Aquifer, the limestone is highly permeable and transmission rates are high, so water moves through it relatively quickly. By contrast, deeper down in the formation, the saline water portion of the Aquifer has low transmission rates and much higher residence times. When water is in contact with limestone, it continually dissolves mineral solids from the surrounding rock matrix. Eventually, the concentration of total dissolved solids (TDS) becomes greater than about 1000 ppm, and the water is considered saline and not drinkable (seawater is about 33,000 ppm). The "bad water line" is a natural phenomenon that occurs along the southern and eastern edges of the fresh water zone where water has been in contact with limestone for a long time. Since the rock in the saline water zone is less permeable and does not transmit water as easily, the movement of water is slower. As a result, water stays in contact with limestone longer and becomes more saline. During dry times or when the Aquifer is drawn down to low levels, it is possible that salt water would intrude along the interface between the fresh and saline sections of the Aquifer, but it would probably be flushed back out again when water levels rose. A study by Ewing and Wilbert in 1991 concluded that water quality deterioration, in all cases except actual ground-water mining, would be temporary and limited largely due to the significant difference in permeability between the fresh and saline sections of the Aquifer and to the flushing action that would occur with renewed increase in recharge. In 1996 the United States Geological Survey established a program to monitor possible changes in water quality near the fresh / saline water interface that might result when drought occurs. Water quality monitors were installed at four wells near the interface for early detection of saline water encroachment into the fresh water zone and to provide information on seasonal variations in water quality. Data collected in 1996-1997 will serve as a baseline to be used for comparison with new data that might be collected during a future drought (USGS, 1998). In 2015 a study by the United States Geological Survey focused on developing a model to simulate the interaction between freshwater and saline water in the area where they mix. The model results indicated that effects on fresh water during a severe drought would be minor (Brakefield, et al., 2015). This added support to the earlier conclusions by Ewing and Wilbert in 1991. USGS scientist Linzy Brakefield said "While the model shows little potential for movement of brackish water into freshwater, the research suggests there is a need for an improved understanding of some parts of the Edwards Aquifer flow system. Better knowledge of how the Aquifer is recharged and the relationship between recharge, pumping, and springflow is needed. With the new developments from this study there is potential to develop more accurate models in the future."
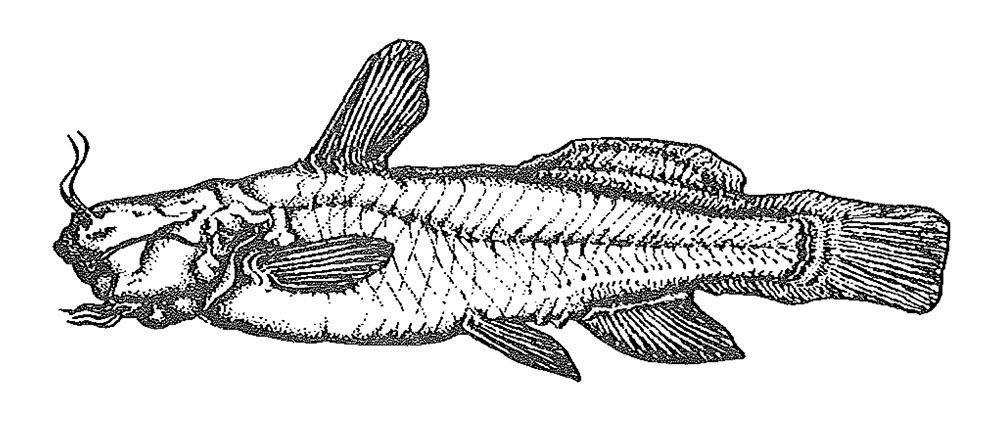
One of the interesting aspects of the fresh water / saline water interface is the deep-water species that apparently can only be found where these waters of different chemistry converge. The juxtaposition of two geochemically distinct waters creates an energy gradient, known as a redox gradient, that can support diverse ecological communities, especially microbial communities (Engel, in Zara, 2010). Very little is known regarding microbes, but a number of amphipods, decapods, isopods, and catfish have been collected from deep-water wells. In 1978, Longley and Karnei noted that both the Toothless blindcat (Trogloglanis pattersoni) and the Widemouth blindcat (Satan eurystomus) were only found in wells more than 1,000 feet deep. Until 2016, these are the only two species of blind catfish known in the United States. In June of that year scientists at the University of Texas at Austin announced they had identified a third blind catfish living in a deep limestone cave near Del Rio (see the discussion on the San Felipe Springs page.)
In 2010, ZARA Environmental completed a new report on deep water biota in which they sampled new locations along the fresh water / saline water interface and also historical locations where species were previously found. Among other achievements, they collected specimens and added new localities for both species of blind catfish, discovered 20 new localities for Aquifer crustaceans, documented an entire order of crustaceans previously unknown in the Edwards, and discovered a species of copepod previously unknown to science (ZARA, 2010). The ZARA scientists noted the large number of new localities discovered demonstrates how much more remains to be found. They suggested that genetic analysis of abundant species could provide estimates of migrants per generation between sites, and therefore give an indication of connectedness between localities. They also suggested it is worth opening our imagination to developing new technologies for exploration and the non-traditional use of existing technologies, such as advanced data collection devices and remotely operated vehicles. Imagine an enterable shaft designed for travel into the Aquifer - it could "provide enormous benefits in terms of species understanding, conservation, and education."
|
||||||||||||||||||||||||||||||||||||||||||||||||||||||||||||||||||||||